
GTF Demand Supply Indicator for TradingView: Pine Script v6, Order Block और Setup Guide
TradingView के लिए GTF Demand Supply Indicator Pine Script v6 को इंस्टॉल करना सीखें। Green Demand Zone, Red Supply Zone, BOS/CHoCH, HTF trend, Entry, Stop Loss, Target और Alerts की पूरी गाइड।
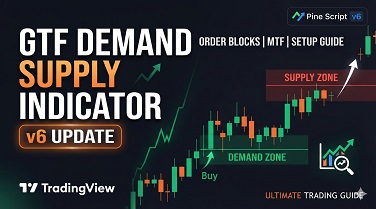
GTF Demand Supply Framework Indicator TradingView के लिए बनाया गया Pine Script v6 इंडिकेटर है। यह मार्केट स्ट्रक्चर के आधार पर Order Block को स्पष्ट हरे Demand Zone और लाल Supply Zone के रूप में दिखाता है। साथ में HTF trend, BOS/CHoCH, संभावित BUY/SELL signals, Entry, Stop Loss, Target, dashboard और alerts उपलब्ध हैं।
इंडिकेटर की मुख्य विशेषताएँ
- Demand Zone (हरा): Bullish structure break के समय पीछे की bearish candle से zone बनता है।
- Supply Zone (लाल): Bearish structure break के समय पीछे की bullish candle से zone बनता है।
- BOS / CHoCH: Swing highs/lows के टूटने पर structure labels।
- HTF Trend Filter: डिफ़ॉल्ट 60-minute timeframe और EMA 50 के आधार पर bias।
- Fresh / Tested Zone: Zone पर price वापस आने पर उसे tested दिखाया जाता है।
- Risk levels: संभावित entry, ATR buffer के साथ stop-loss और configurable risk-reward target।
- Dashboard & Alerts: Trend, structure, zone status और buy/sell alert conditions।
TradingView में Script कैसे लगाएँ?
- TradingView खोलें और Nifty 50, Bank Nifty या अपनी पसंद का chart खोलें।
- नीचे Pine Editor खोलें।
- पुराना code हटाकर नीचे दिया गया पूरा code paste करें।
- Save पर क्लिक करें, फिर Add to chart चुनें।
- Settings में Higher Timeframe, EMA Length, Swing Pivot Length, Order Block Search Bars, Zone Extension, ATR Buffer और Risk:Reward अपनी जरूरत के अनुसार सेट करें।
- Alerts के लिए TradingView में Alert बनाएँ और उपलब्ध GTF alert condition चुनें।
चार्ट के रंग और संकेत समझें
- 🟩 हरा बॉक्स — DEMAND ZONE: संभावित buying interest का क्षेत्र; यह buy की गारंटी नहीं है।
- 🟥 लाल बॉक्स — SUPPLY ZONE: संभावित selling interest का क्षेत्र; यह sell की गारंटी नहीं है।
- नीली लाइन: आखिरी signal की entry price।
- लाल dashed line: Stop Loss।
- हरी dashed line: Risk:Reward setting के अनुसार target।
- BOS: Break of Structure; CHoCH: Change of Character।
GTF Demand Supply Framework — Pine Script v6 Code
नीचे का code पूरा copy करें। Pine Editor में पहली लाइन //@version=6 से शुरू होनी चाहिए।
//@version=6
indicator("GTF Demand Supply Framework", overlay=true, max_boxes_count=20, max_labels_count=100, max_lines_count=20)

// ───── SETTINGS ─────
groupTrend = "1. Global Trend"
htf = input.timeframe("60", "Higher Timeframe", group=groupTrend)
emaLen = input.int(50, "HTF EMA Length", minval=1, group=groupTrend)

groupStructure = "2. Market Structure"
pivotLen = input.int(5, "Swing Pivot Length", minval=2, group=groupStructure)
obLookback = input.int(20, "Order Block Search Bars", minval=2, maxval=100, group=groupStructure)
zoneExtend = input.int(150, "Zone Extension (bars)", minval=10, maxval=500, group=groupStructure)

groupRisk = "3. Entry / Risk Management"
atrLen = input.int(14, "ATR Length", minval=1, group=groupRisk)
atrBuffer = input.float(0.20, "SL Buffer (ATR)", minval=0, step=0.05, group=groupRisk)
rr = input.float(2.0, "Target Risk:Reward", minval=0.5, step=0.5, group=groupRisk)
showTradeLevels = input.bool(true, "Show Entry / SL / Target", group=groupRisk)

groupDisplay = "4. Display"
showStructure = input.bool(true, "Show BOS / CHoCH", group=groupDisplay)
showDashboard = input.bool(true, "Show Dashboard", group=groupDisplay)
showZones = input.bool(true, "Show Demand / Supply Zones", group=groupDisplay)

// ───── HTF TREND ─────
htfClose = request.security(syminfo.tickerid, htf, close[1], lookahead=barmerge.lookahead_on)
htfEma = request.security(syminfo.tickerid, htf, ta.ema(close, emaLen)[1], lookahead=barmerge.lookahead_on)
trendBull = htfClose > htfEma
trendBear = htfClose < htfEma
trendText = trendBull ? "BULLISH" : trendBear ? "BEARISH" : "NEUTRAL"

// ───── SWING STRUCTURE ─────
ph = ta.pivothigh(high, pivotLen, pivotLen)
pl = ta.pivotlow(low, pivotLen, pivotLen)

var float lastHigh = na
var float lastLow = na
var bool highBroken = false
var bool lowBroken = false
var int structureDir = 0

if not na(ph)
    lastHigh := ph
    highBroken := false

if not na(pl)
    lastLow := pl
    lowBroken := false

bullBreak = not na(lastHigh) and close > lastHigh and not highBroken
bearBreak = not na(lastLow) and close < lastLow and not lowBroken

bullChoch = bullBreak and structureDir == -1
bearChoch = bearBreak and structureDir == 1
bullBos = bullBreak and structureDir != -1
bearBos = bearBreak and structureDir != 1

if bullBreak
    highBroken := true
    structureDir := 1

if bearBreak
    lowBroken := true
    structureDir := -1

if showStructure and bullBreak
    label.new(bar_index, low, bullChoch ? "Bullish CHoCH" : "Bullish BOS",
      style=label.style_label_up, color=color.new(color.green, 0),
      textcolor=color.white, size=size.tiny)

if showStructure and bearBreak
    label.new(bar_index, high, bearChoch ? "Bearish CHoCH" : "Bearish BOS",
      style=label.style_label_down, color=color.new(color.red, 0),
      textcolor=color.white, size=size.tiny)

// ───── ORDER BLOCK ZONES ─────
var box demandBox = na
var box supplyBox = na
var float demandTop = na
var float demandBottom = na
var float supplyTop = na
var float supplyBottom = na
var bool demandMitigated = false
var bool supplyMitigated = false

// Bullish break: find the nearest prior bearish candle.
if bullBreak
    int found = na
    for i = 1 to obLookback
        if na(found) and close[i] < open[i]
            found := i
    if not na(found)
        demandTop := high[found]
        demandBottom := low[found]
        demandMitigated := false
        if not na(demandBox)
            box.delete(demandBox)
        demandBox := box.new(left=bar_index-found, top=demandTop,
          right=bar_index+zoneExtend, bottom=demandBottom,
          xloc=xloc.bar_index,
          border_color=color.new(color.lime, 0),
          bgcolor=showZones ? color.new(color.lime, 84) : color.new(color.lime, 100),
          text="DEMAND ZONE", text_color=color.lime,
          text_size=size.small, text_halign=text.align_center)

// Bearish break: find the nearest prior bullish candle.
if bearBreak
    int found = na
    for i = 1 to obLookback
        if na(found) and close[i] > open[i]
            found := i
    if not na(found)
        supplyTop := high[found]
        supplyBottom := low[found]
        supplyMitigated := false
        if not na(supplyBox)
            box.delete(supplyBox)
        supplyBox := box.new(left=bar_index-found, top=supplyTop,
          right=bar_index+zoneExtend, bottom=supplyBottom,
          xloc=xloc.bar_index,
          border_color=color.new(color.red, 0),
          bgcolor=showZones ? color.new(color.red, 84) : color.new(color.red, 100),
          text="SUPPLY ZONE", text_color=color.red,
          text_size=size.small, text_halign=text.align_center)

// Keep the active zones extending to the latest candle.
if not na(demandBox)
    box.set_right(demandBox, bar_index + zoneExtend)
    box.set_bgcolor(demandBox, showZones ? color.new(color.lime, demandMitigated ? 93 : 84) : color.new(color.lime, 100))
    box.set_text(demandBox, demandMitigated ? "DEMAND • TESTED" : "DEMAND ZONE")

if not na(supplyBox)
    box.set_right(supplyBox, bar_index + zoneExtend)
    box.set_bgcolor(supplyBox, showZones ? color.new(color.red, supplyMitigated ? 93 : 84) : color.new(color.red, 100))
    box.set_text(supplyBox, supplyMitigated ? "SUPPLY • TESTED" : "SUPPLY ZONE")

// ───── FIRST-TOUCH ENTRY SIGNALS ─────
atr = ta.atr(atrLen)

demandTouch = not na(demandTop) and low <= demandTop and high >= demandBottom
supplyTouch = not na(supplyBottom) and high >= supplyBottom and low <= supplyTop

buySignal = demandTouch and not demandMitigated and close > open and trendBull
sellSignal = supplyTouch and not supplyMitigated and close < open and trendBear

if demandTouch
    demandMitigated := true
if supplyTouch
    supplyMitigated := true

plotshape(buySignal, title="GTF Buy", text="BUY", style=shape.labelup,
  location=location.belowbar, color=color.green, textcolor=color.white, size=size.small)
plotshape(sellSignal, title="GTF Sell", text="SELL", style=shape.labeldown,
  location=location.abovebar, color=color.red, textcolor=color.white, size=size.small)

// ───── ENTRY / STOP / TARGET ─────
var line entryLine = na
var line slLine = na
var line tpLine = na
var float lastEntry = na
var float lastSL = na
var float lastTP = na
var string lastSignal = "WAIT"

if buySignal
    lastEntry := close
    lastSL := demandBottom - atr * atrBuffer
    lastTP := lastEntry + (lastEntry - lastSL) * rr
    lastSignal := "BUY"
    if not na(entryLine)
        line.delete(entryLine)
    if not na(slLine)
        line.delete(slLine)
    if not na(tpLine)
        line.delete(tpLine)
    if showTradeLevels
        entryLine := line.new(bar_index, lastEntry, bar_index+zoneExtend, lastEntry, color=color.blue, width=2)
        slLine := line.new(bar_index, lastSL, bar_index+zoneExtend, lastSL, color=color.red, width=2, style=line.style_dashed)
        tpLine := line.new(bar_index, lastTP, bar_index+zoneExtend, lastTP, color=color.green, width=2, style=line.style_dashed)

if sellSignal
    lastEntry := close
    lastSL := supplyTop + atr * atrBuffer
    lastTP := lastEntry - (lastSL - lastEntry) * rr
    lastSignal := "SELL"
    if not na(entryLine)
        line.delete(entryLine)
    if not na(slLine)
        line.delete(slLine)
    if not na(tpLine)
        line.delete(tpLine)
    if showTradeLevels
        entryLine := line.new(bar_index, lastEntry, bar_index+zoneExtend, lastEntry, color=color.blue, width=2)
        slLine := line.new(bar_index, lastSL, bar_index+zoneExtend, lastSL, color=color.red, width=2, style=line.style_dashed)
        tpLine := line.new(bar_index, lastTP, bar_index+zoneExtend, lastTP, color=color.green, width=2, style=line.style_dashed)

// ───── DASHBOARD ─────
var table dash = table.new(position.top_right, 2, 6, border_width=1)

if barstate.islast and showDashboard
    table.cell(dash, 0, 0, "GTF FRAMEWORK", bgcolor=color.navy, text_color=color.white)
    table.cell(dash, 1, 0, syminfo.ticker, bgcolor=color.navy, text_color=color.white)
    table.cell(dash, 0, 1, "HTF Bias", text_color=color.white, bgcolor=color.gray)
    table.cell(dash, 1, 1, trendText, text_color=color.white, bgcolor=trendBull ? color.green : trendBear ? color.red : color.gray)
    table.cell(dash, 0, 2, "Structure", text_color=color.white, bgcolor=color.gray)
    table.cell(dash, 1, 2, structureDir == 1 ? "BULLISH" : structureDir == -1 ? "BEARISH" : "NEUTRAL", text_color=color.white, bgcolor=structureDir == 1 ? color.green : structureDir == -1 ? color.red : color.gray)
    table.cell(dash, 0, 3, "Demand Zone", text_color=color.white, bgcolor=color.gray)
    table.cell(dash, 1, 3, na(demandBottom) ? "Not found" : (demandMitigated ? "Tested" : "Fresh"), text_color=color.white, bgcolor=demandMitigated ? color.gray : color.green)
    table.cell(dash, 0, 4, "Supply Zone", text_color=color.white, bgcolor=color.gray)
    table.cell(dash, 1, 4, na(supplyBottom) ? "Not found" : (supplyMitigated ? "Tested" : "Fresh"), text_color=color.white, bgcolor=supplyMitigated ? color.gray : color.red)
    table.cell(dash, 0, 5, "Last Signal", text_color=color.white, bgcolor=color.gray)
    table.cell(dash, 1, 5, lastSignal, text_color=color.white, bgcolor=lastSignal == "BUY" ? color.green : lastSignal == "SELL" ? color.red : color.gray)

if barstate.islast and not showDashboard
    table.clear(dash, 0, 0, 1, 5)

// ───── ALERTS ─────
alertcondition(buySignal, title="GTF BUY Signal", message="GTF BUY: price touched a fresh Demand Zone with bullish HTF bias.")
alertcondition(sellSignal, title="GTF SELL Signal", message="GTF SELL: price touched a fresh Supply Zone with bearish HTF bias.")
alertcondition(bullBreak, title="Bullish BOS / CHoCH", message="Bullish market structure break detected.")
alertcondition(bearBreak, title="Bearish BOS / CHoCH", message="Bearish market structure break detected.")
Recommended Starting Settings
| Setting | Starting value |
|---|---|
| Chart timeframe | 5 minutes (testing only) |
| Higher Timeframe | 60 minutes |
| HTF EMA Length | 50 |
| Swing Pivot Length | 5 |
| Order Block Search Bars | 20 |
| Zone Extension | 150 bars |
| ATR Length / SL Buffer | 14 / 0.20 ATR |
| Target Risk:Reward | 2.0R |
महत्वपूर्ण सीमाएँ और Risk Disclaimer
यह एक educational chart indicator है, broker order-execution strategy नहीं। Order Block की पहचान एक नियम-आधारित approximation है; वास्तविक institutional order flow की पुष्टि नहीं। यह संस्करण chart timeframe पर structure देखता है और HTF EMA bias का filter लगाता है; अलग 15-minute confirmation filter शामिल नहीं है। Zone touch या candle signal से लाभ की गारंटी नहीं होती। पहले Pine Editor में compile करें, Bar Replay और Paper Trading पर जाँचें; वास्तविक पैसे से पहले अपने risk rules लागू करें। Stop Loss और target lines संभावित स्तर हैं, execution या fill की गारंटी नहीं।
SEO Keywords: GTF Indicator, TradingView Pine Script v6, Demand Supply Zone Indicator, Order Block Indicator, BOS CHoCH, Nifty 50 Trading Indicator, ICT SMC Trading, Stop Loss Target Indicator.